The Graphical User Interface
Run the GUI by executing the following command in the terminal:
./build/gui
Next, you will be greeted by the main window, which is divided into multiple tabs:
Help
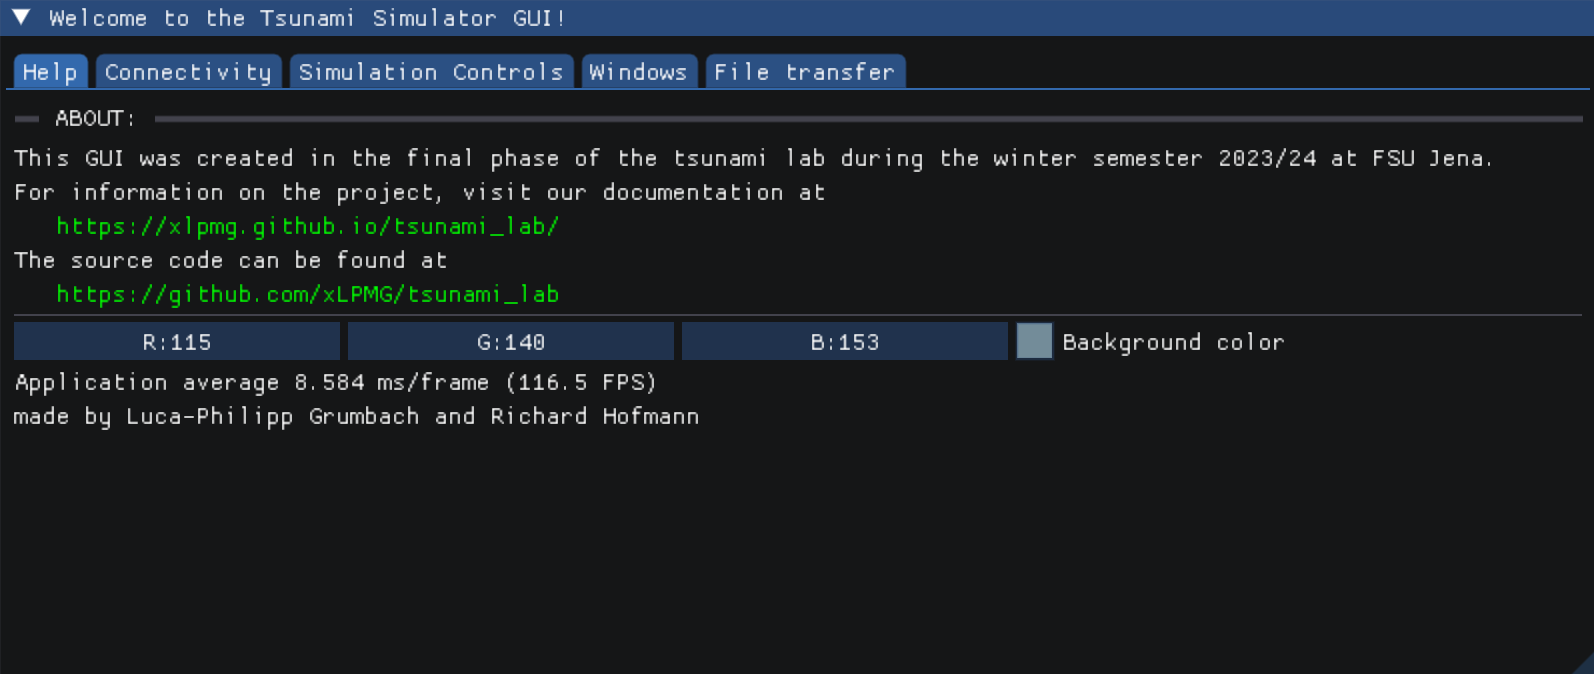
This tab currently only contains a link to the documentation. However we plan to add more information here in the future.
Connectivity
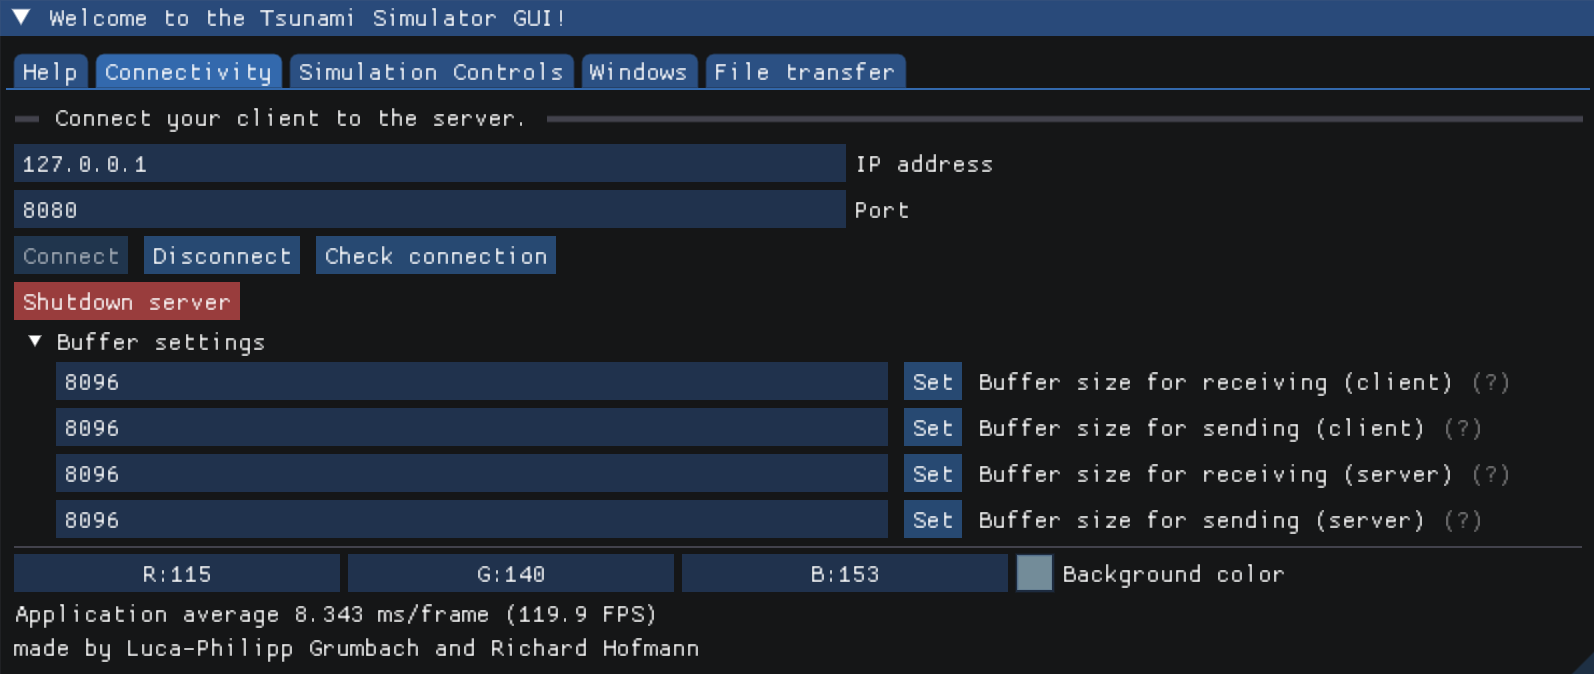
This tab is used to connect to the server, which is the device that actually runs the simulation. This can be a remote machine or the local machine. After starting the server application from the command line, you can connect to it using this tab. Simply enter the IP address and port of the target device and the GUI will try to connect to it.
You also the option to change the buffer sizes, however the default values should be sufficient for most use cases. Explanations on what these values do can be found within the GUI itself.
Simulation controls
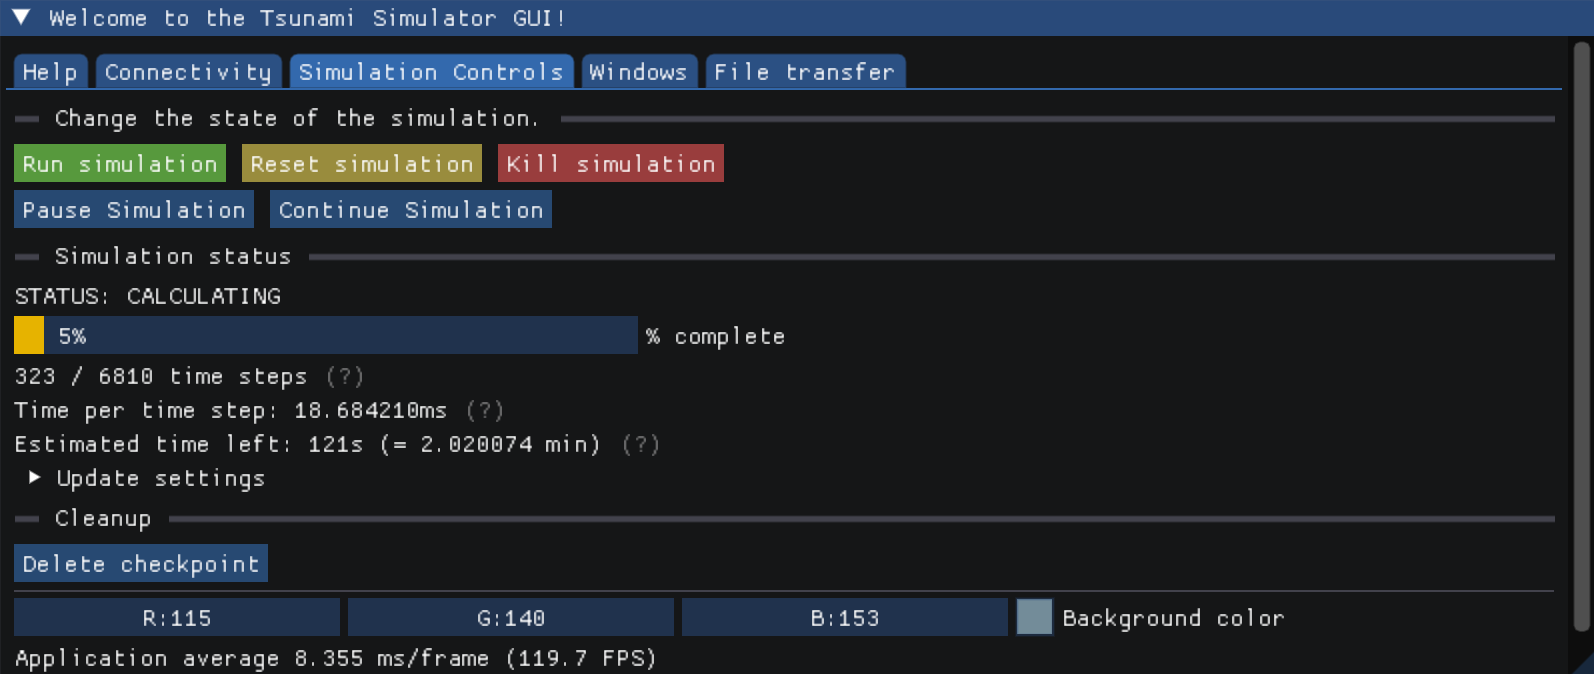
This is where you control the simulation. The main actions here are Run, Reset and Kill. Information on Run and Reset are also found within the GUI. You may also pause and continue the simulation.
Below those buttons, you can find the current simulation status.
The first value tells you what the simulator is doing right now, which can be either CALCULATING, PREPARING`, ``RESETTING or IDLE.
If it is currently CALCULATING, a progress bar will show you how far the simulation has progressed.
If you prefer numbers instead of percentages, you can get this info right below in terms of time steps.
The last two values are how long the computation of one time step takes on average (based on all computed time steps so far) and using this value an estimation of how much time is left.
You can also change the update settings, which are the polling interval to the server to gather information and a checkbox if that communication should be logged.
Lastly, there is the Cleanup section. As of now, it only provides you with a button to delete checkpoint data,
but if we encounter any other things the user should be able to delete, we will add them here.
Windows
The windows tab is used to open and close the different windows of the GUI. We will go through them in the following sections.
Configuration windows
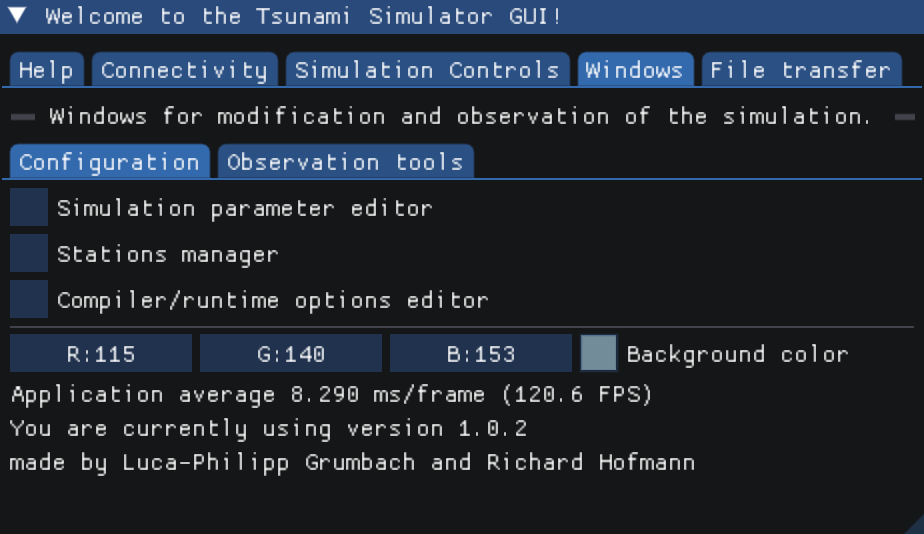
Here you can find windows to configure the simulation parameters, the stations and the compiler/runtime options.
Simulation parameters editor
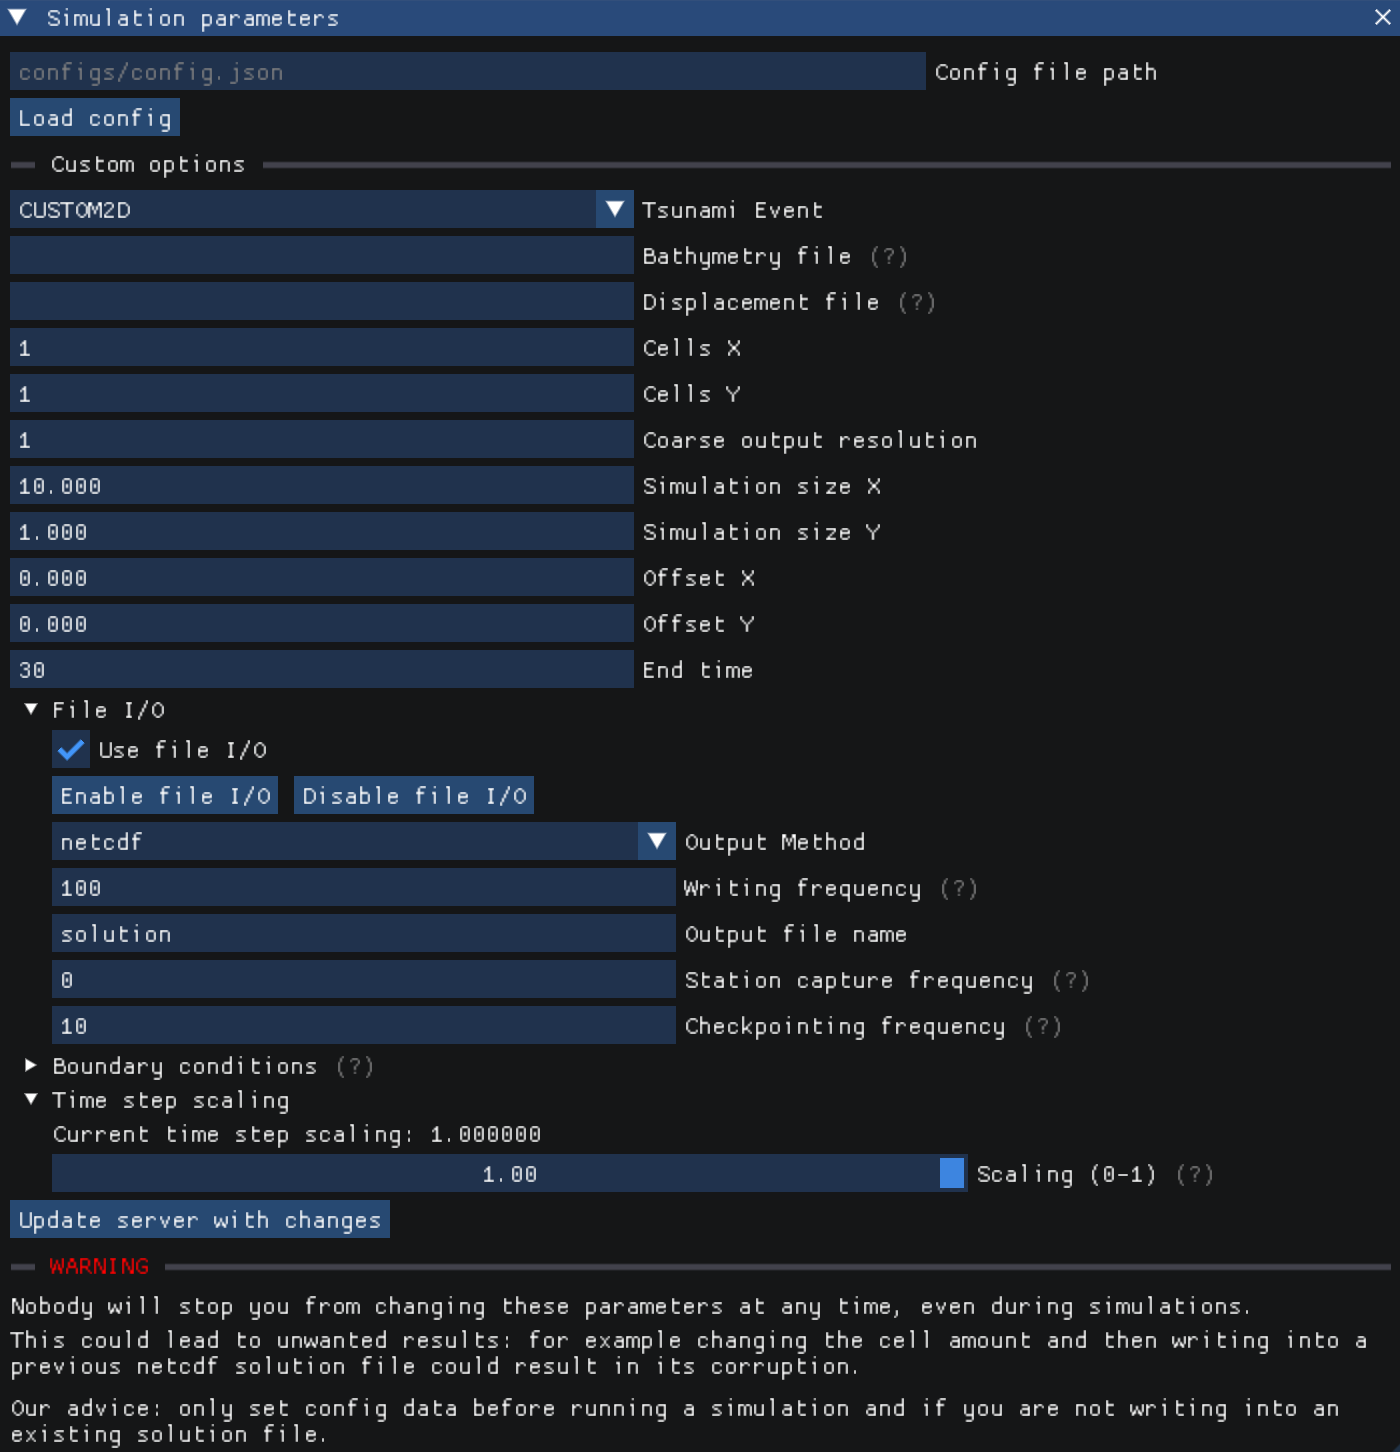
At the top of the window, you find a text input and a Load config button.
Simply input the path to a configuration file (which is located on the same machine the server application is running on) and press the button to load the configuration into the simulator.
You can now run the simulation with the new parameters.
Below that, you find the actual configuration editor. Here you can choose a setup and input all parameters manually. At the bottom you find more options for File I/O, boundary conditions and time step scaling.
For more info on all parameters, please refer to the usage manual.
Stations manager
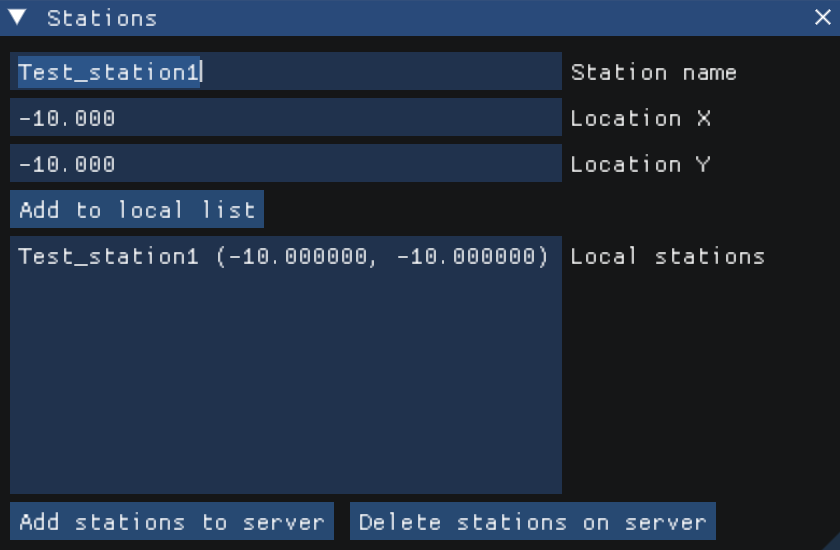
Here you can create stations locally and send them to the server. This means that any station you add to the list in the GUI will be added to the stations that are already present on the server. The second button allows you to delete all stations from the server. You can not remove single stations from the server or override stations with the same name.
Compiler/runtime options editor
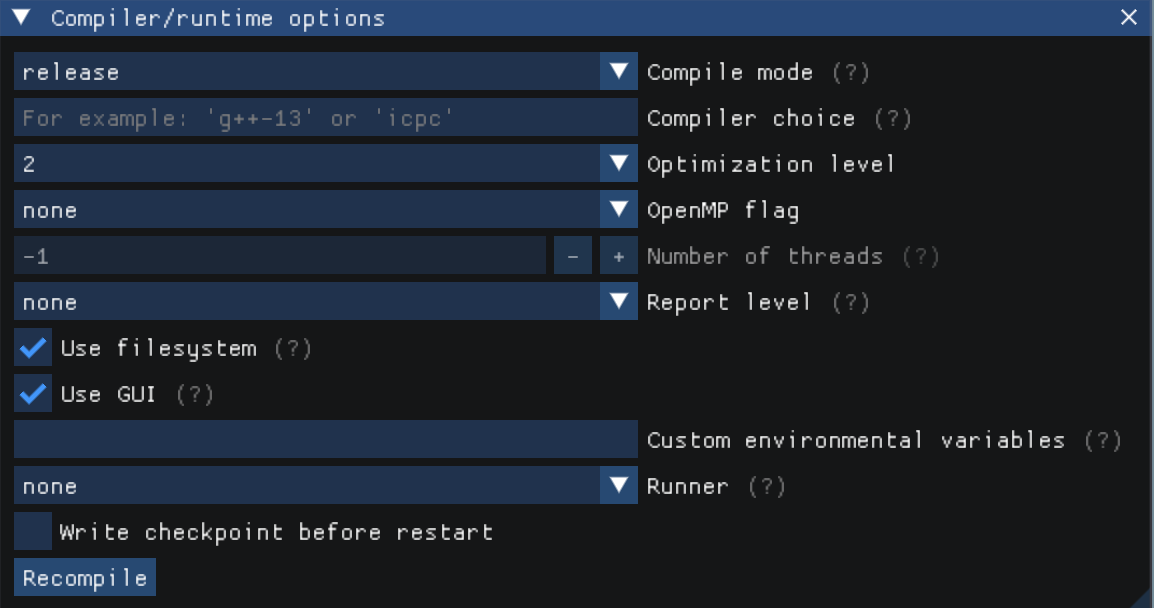
This window lets you recompile the server application with different compiler and runtime options. You may also select a runner to execute the server application with the new options.
Each options is documented within the GUI itself. Please only use this window if you know what you are doing.
Observation windows
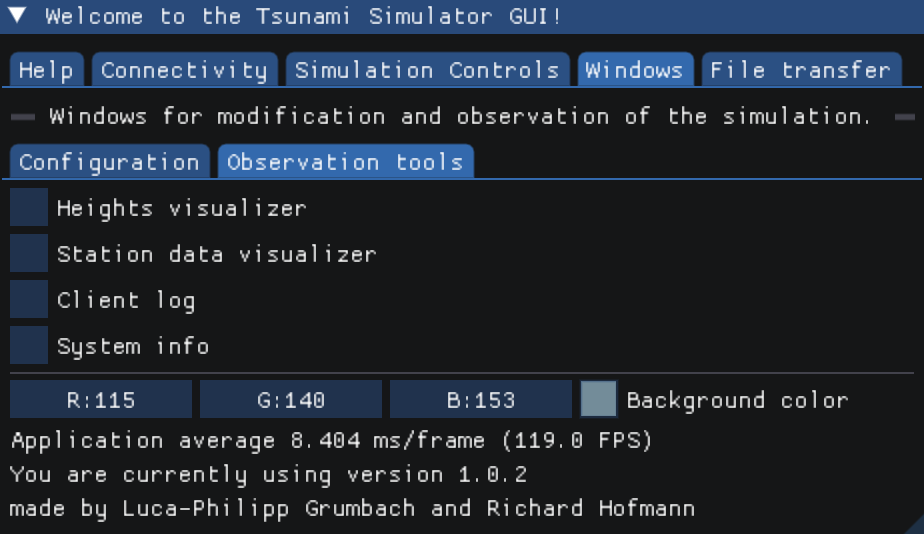
Oberservation windows are used to give the user a better understanding of what is going on by visualizing certain data.
Heights visualizer
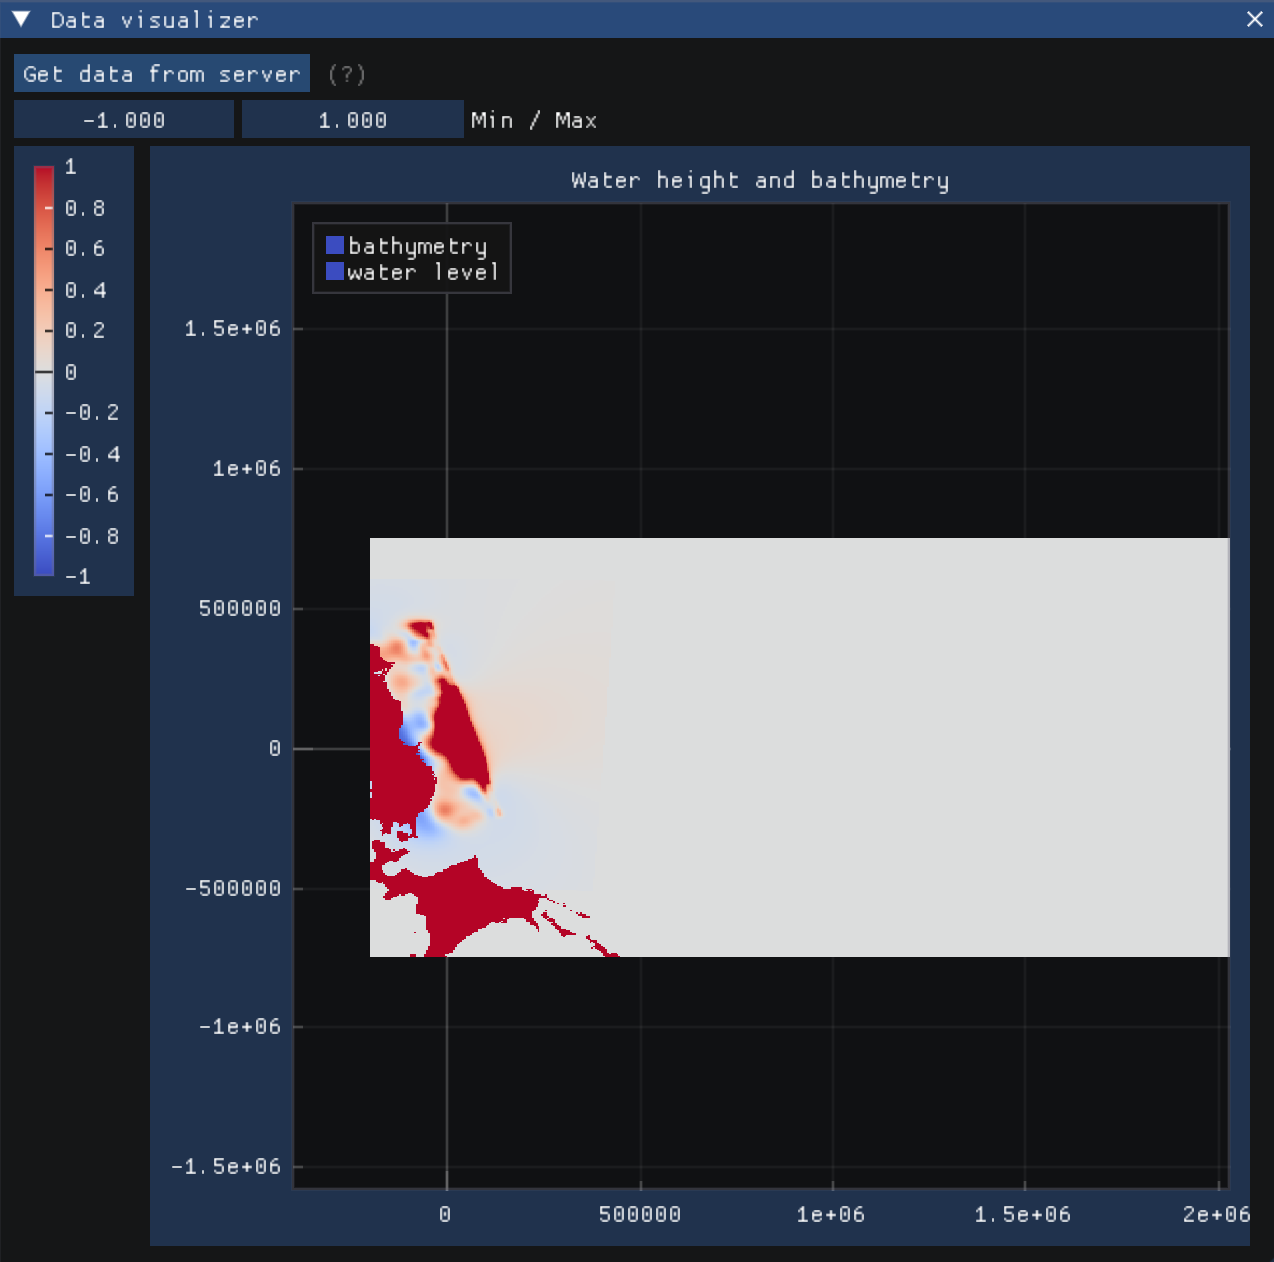
The heights visualizer is used to visualize the water level and bathymetry of the simulator. The data is grabbed directly from the Simulator mid-computation and sent to the GUI for visualization. It will give you direct insight on how far the simulation has progressed and what the current state of the simulation is.
You may view the water level
or the bathymetry
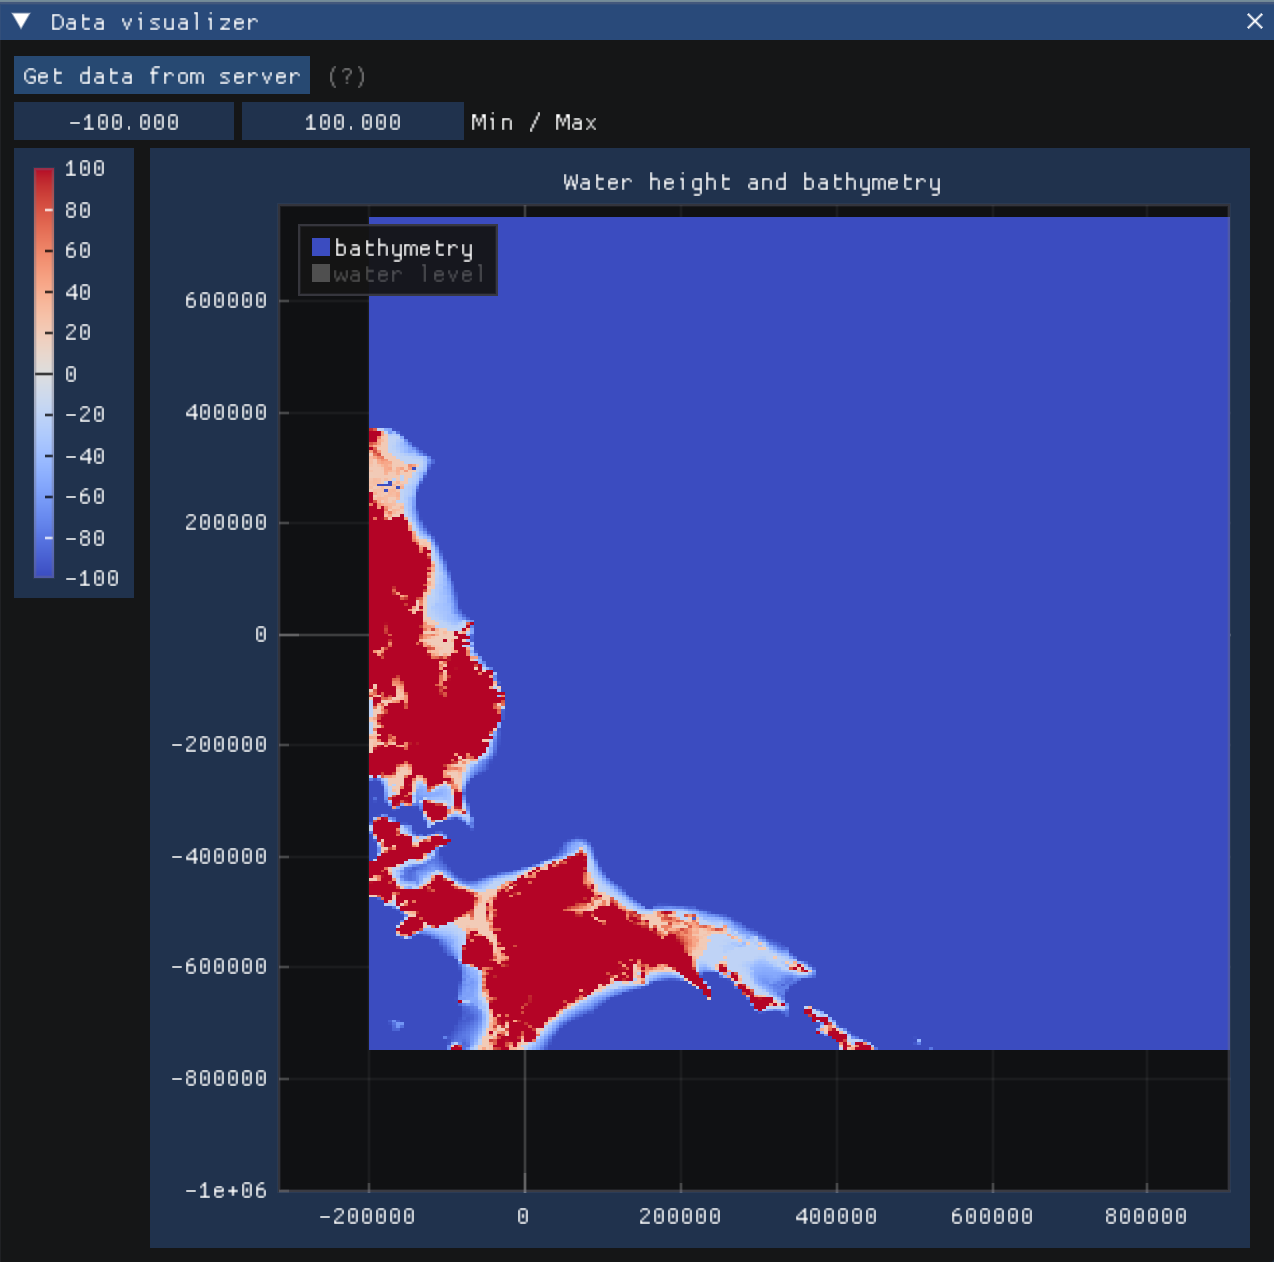
by selecting the respective data in the top left corner of the graph. You may also change the color scale at the top by entering the minimum and maximum values. Hover over the scales on the left and bottom and scroll to scale the graph. Or simply click the scale to automatically resize it.
Note
If your simulation has a large amount of cells, the data size will therefore be large as well. Expect that the GUI will freeze while the data is being sent/received. We are working on a solution to this problem to handle the data asynchronously.
Station data visualizer
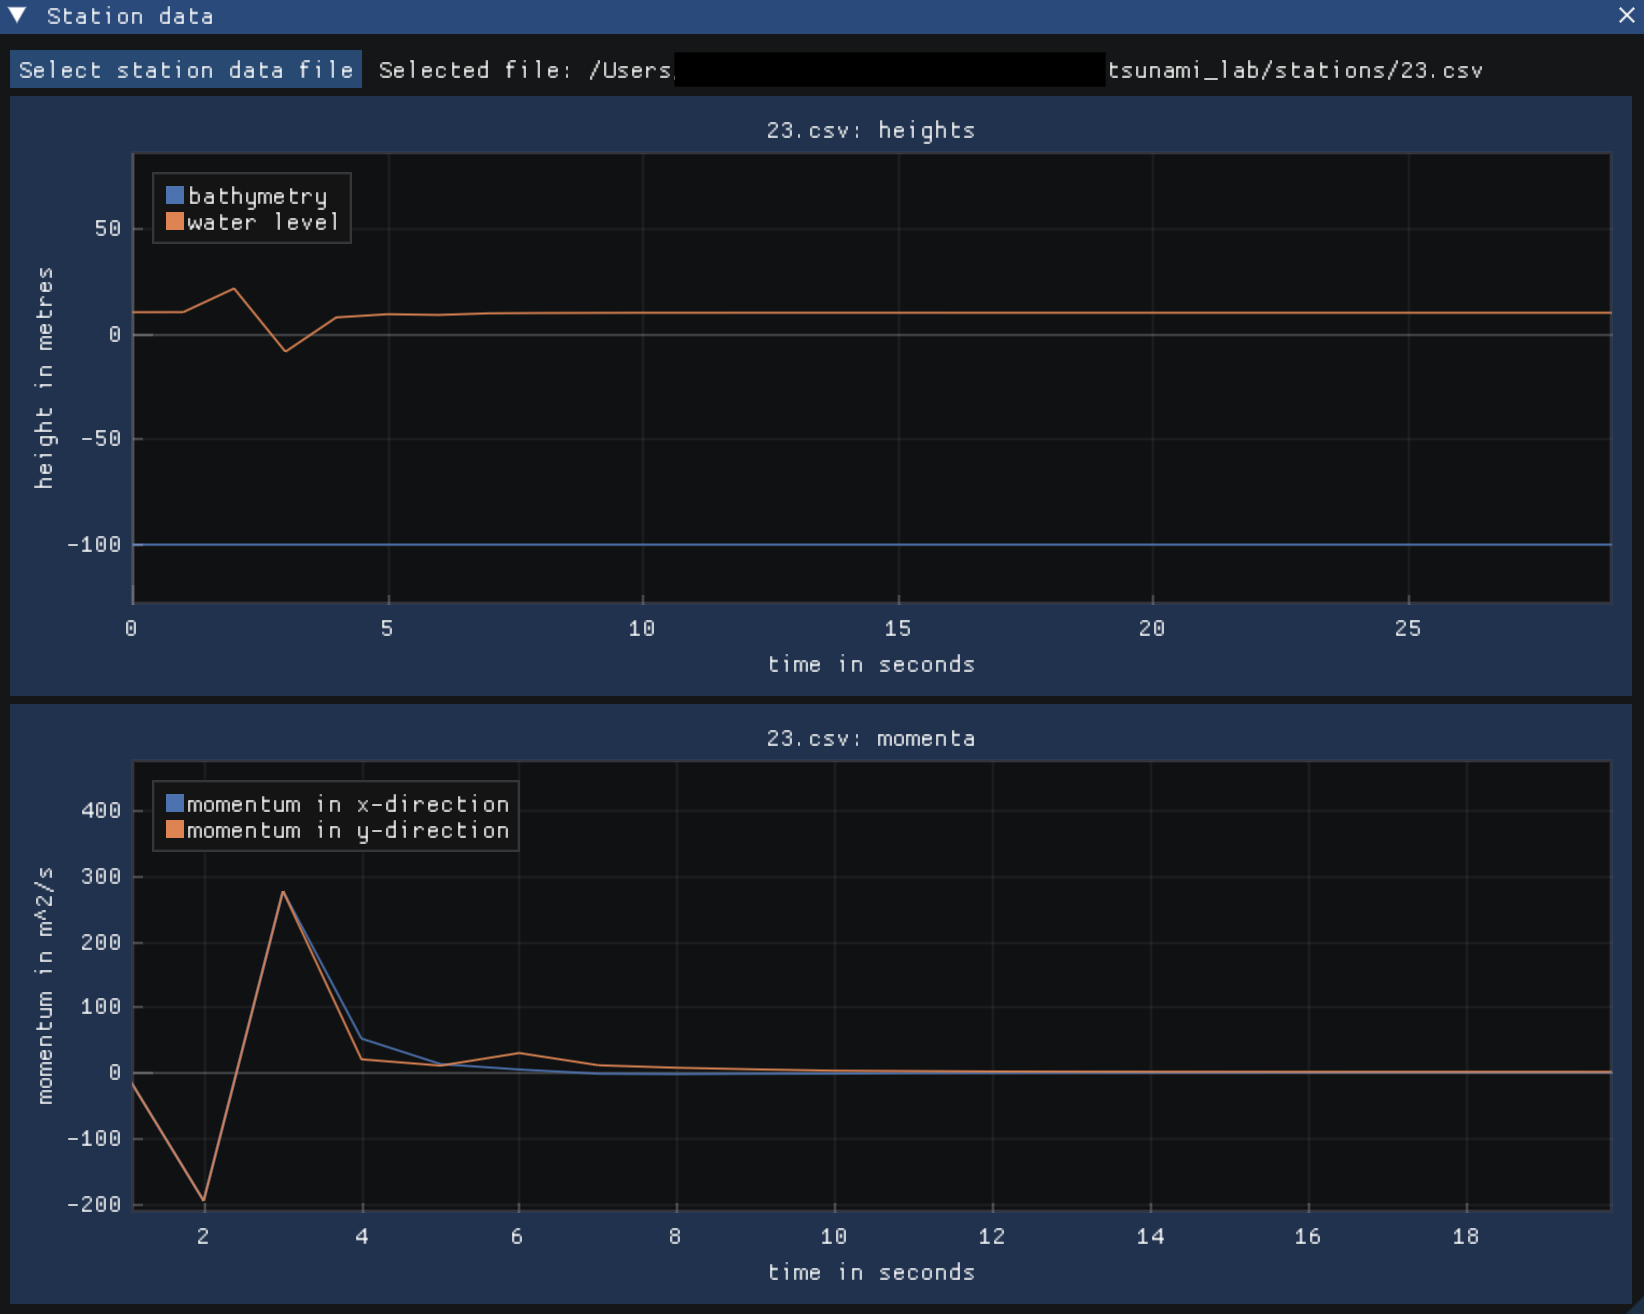
Use the button at the top to select a station data .csv file from the file system.
The top graph will display water and bathymetry height, and the bottom graph the momentum of the water. Hover over the scales on the left and bottom and scroll to scale the graph. Or simply click the scale to automatically resize it.
You may also click on the legend to hide/show the respective data.
Client log
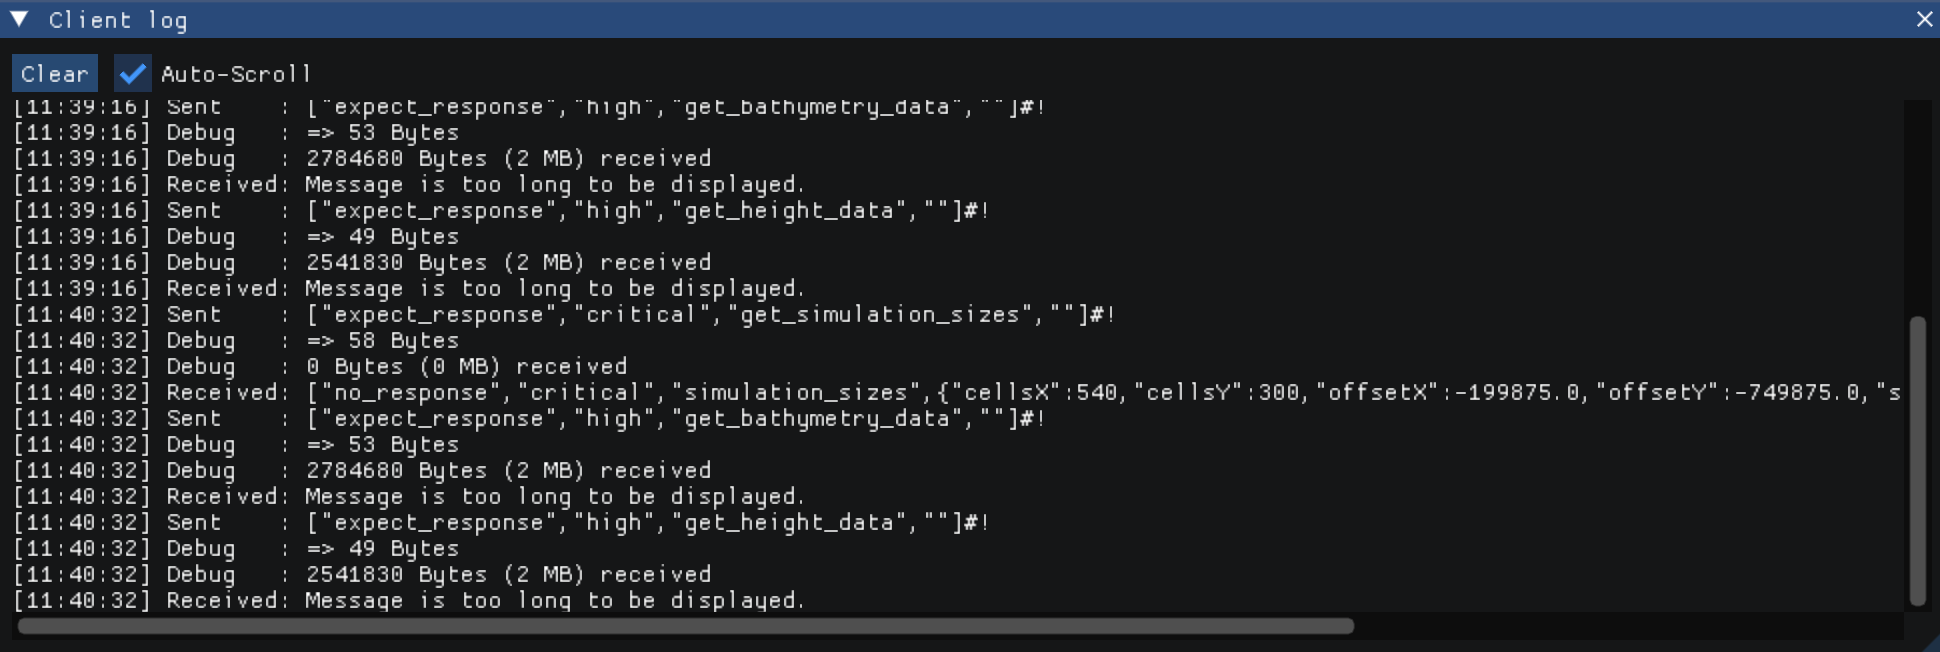
The client log provided you with info on data transmission of the client application and the server.
System info

The first line shows the RAM usage. Below that, you can see the overall CPU usage of the server application. On Linux, you may view the indivual core usage as well.
Lastly, the update frequency determines how often the data is gathered from the server. Specify it in seconds.
File Transfer
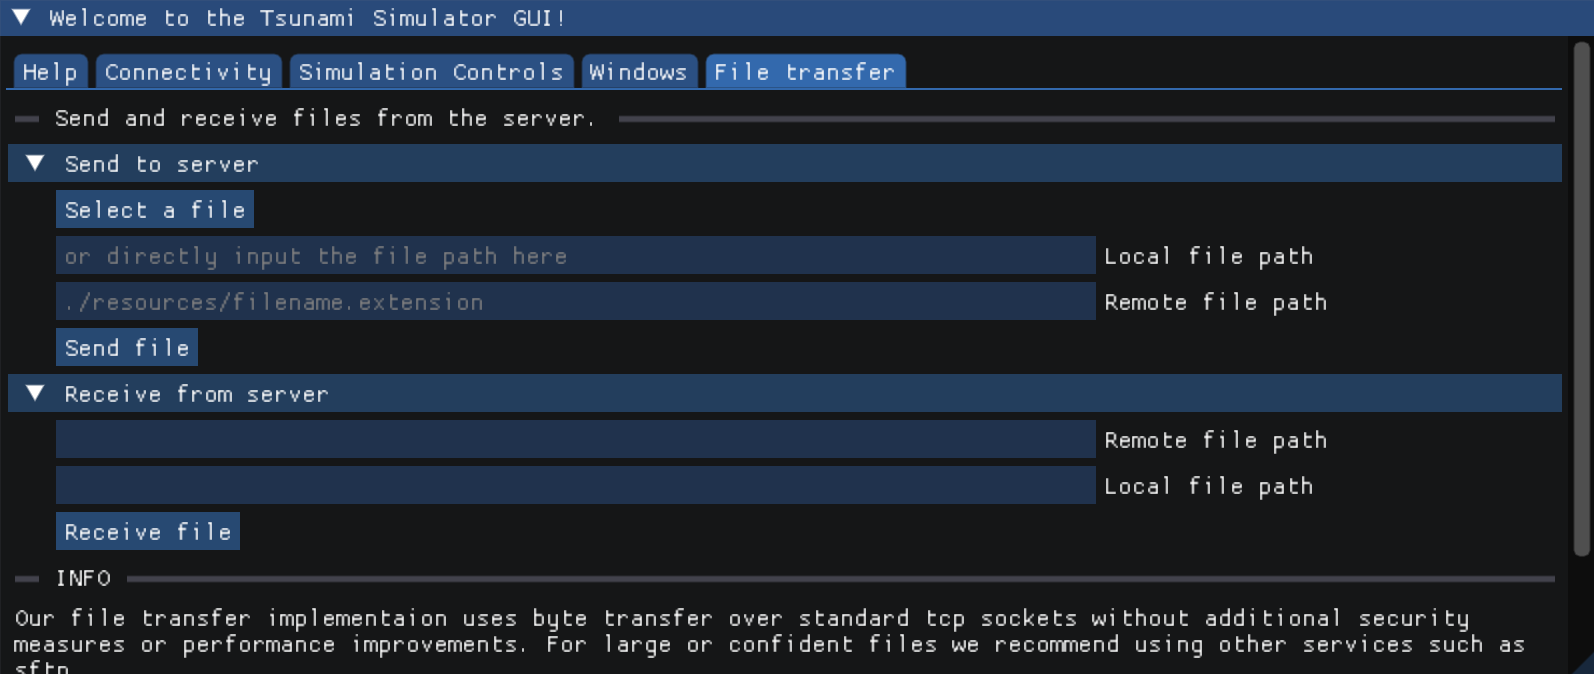
In case you are not familiar with sftp or similar file transfer tools, you may use our naive implementation.
Simply enter the file paths of where the file is (when sending) or should be (when receiving) located on your local machine.
Do the same for the server paths and press the respective button to start the transfer. The log will show you the progress.